Small Business KPIs & Analytics: Your Guide to Data-Driven Growth
By Ralph Johnson, Founder
In today's competitive landscape, small businesses can't afford to operate on guesswork. The key to sustainable growth lies in understanding your performance through data. That's where Key Performance Indicators (KPIs) and robust analytics come into play. By tracking the right metrics, you can gain invaluable insights, make informed decisions, and propel your business forward.
The Power of KPIs for Small Businesses
KPIs are measurable values that demonstrate how effectively a company is achieving key business objectives. For small businesses, they act as a compass, guiding your strategies and highlighting areas for improvement. Without them, you're essentially flying blind.
Essential KPIs Every Small Business Should Track
Revenue Metrics: Understanding Your Financial Engine
- Monthly Recurring Revenue (MRR): This metric is crucial for subscription-based businesses, representing the predictable revenue generated each month.
- Annual Recurring Revenue (ARR): Similar to MRR, but on an annual basis.
- Average Transaction Value (ATV): The average amount a customer spends per transaction. Increasing ATV can significantly boost your overall revenue.
Marketing Metrics: Optimizing Your Outreach
- Customer Acquisition Cost (CAC): The cost associated with acquiring a new customer. A healthy CAC ensures your marketing efforts are profitable.
- Return on Ad Spend (ROAS): Measures the revenue generated for every dollar spent on advertising. Aim for a ROAS that significantly outweighs your ad spend.
- Conversion Rates: The percentage of visitors or leads who complete a desired action, such as making a purchase or filling out a form.
Customer Metrics: Building Lasting Relationships
- Customer Lifetime Value (LTV): The total revenue a business can reasonably expect from a single customer account throughout their relationship. Ideally, your LTV should be significantly higher than your CAC.
- Churn Rate: The rate at which customers stop doing business with you. A high churn rate indicates issues with customer satisfaction or retention.
- Net Promoter Score (NPS): Measures customer loyalty by asking how likely they are to recommend your business to others.
Operational Metrics: Streamlining Your Business
- Utilization Rate: For service-based businesses, this measures how much of employees' time is spent on billable work.
- Profit Margins (Gross and Net): Gross profit margin indicates the percentage of revenue left after deducting the cost of goods sold, while net profit margin considers all expenses.
Setting Up Google Analytics 4 (GA4)
Google Analytics 4 is a powerful web analytics service that tracks and reports website traffic. It offers a more event-driven data model than its predecessor, providing deeper insights into user behavior.
- Create a Google Analytics Account: If you don't have one, start by creating a free account.
- Set Up a GA4 Property: Follow the on-screen instructions to create a new GA4 property for your website.
- Install the GA4 Tracking Code: You'll need to add a small snippet of code to your website's header. This can often be done through your website platform's settings or a plugin.
- Configure Data Streams: Set up data streams for your website and/or app to ensure all relevant data is being collected.
- Define Events and Conversions: Identify key actions on your website (e.g., purchases, form submissions) and configure them as events and conversions in GA4.
Dashboard Tools for Visualizing Your Data
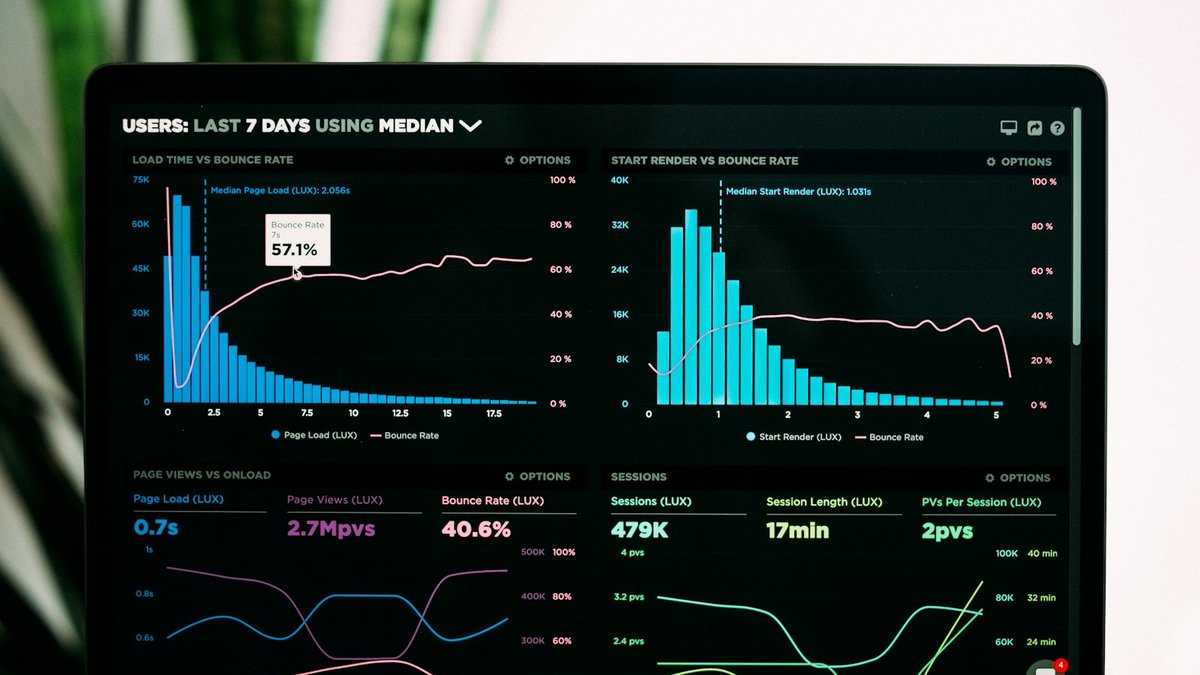
Once you're collecting data, visualizing it in an easy-to-understand format is crucial. Dashboard tools help you consolidate and present your KPIs effectively.
- Google Looker Studio (formerly Google Data Studio): A free, powerful tool that allows you to connect to various data sources (including GA4) and create custom, interactive dashboards.
- Databox: Offers a wide range of integrations and pre-built templates, making it easy to create comprehensive dashboards for different business functions.
Making Data-Driven Decisions
Establish Benchmarks
Understanding what constitutes "good" performance is vital. Benchmarks vary widely by industry, so use these as questions to research for your own market:
- Customer Acquisition Cost (CAC): Varies widely, from low for some online businesses to much higher for B2B.
- Return on Ad Spend (ROAS): Compare revenue to ad spend; what counts as good depends on your margins.
- Conversion Rate: Varies significantly by industry and type of conversion.
- Customer Churn Rate: Track it over time; lower is better, especially for subscription businesses.
- Net Promoter Score (NPS): Higher is better; compare against your own past scores.
- Gross Profit Margin: Varies widely depending on the industry.
It's important to research industry-specific benchmarks for the most accurate comparison. Also, track your own historical performance to identify trends and set internal goals.
Analyze and Interpret
Regularly review your dashboards and reports. Look for trends, anomalies, and correlations. Ask "why" certain metrics are performing the way they are.
Formulate Hypotheses and Test
Based on your analysis, develop hypotheses about what might improve performance. For example, "If we optimize our landing page, our conversion rate will increase by 10%." Then, implement changes and track the results.
Iterate and Optimize
Data-driven decision-making is an ongoing process. Continuously monitor your KPIs, analyze the impact of your actions, and iterate on your strategies for continuous improvement.
Conclusion
Embracing business analytics and actively tracking your KPIs is no longer optional for small businesses – it's a necessity. By leveraging the right metrics and tools, you can gain a clear understanding of your performance, make informed strategic decisions, and pave the way for sustainable growth and long-term success.
FAQ
What are KPIs and why are they important for small businesses?
KPIs (Key Performance Indicators) are measurable values that show how effectively a company is achieving its business objectives. For small businesses, they are crucial because they provide actionable insights into performance, highlight areas for improvement, and help guide strategic decision-making, moving beyond guesswork.
What are some essential revenue metrics for small businesses?
Key revenue metrics include Monthly Recurring Revenue (MRR) and Annual Recurring Revenue (ARR) for subscription models, which indicate predictable income. Another vital metric is Average Transaction Value (ATV), which measures how much customers spend per purchase, offering direct insights into sales performance.
How can I track marketing performance effectively?
Effective marketing tracking involves metrics like Customer Acquisition Cost (CAC), which tells you how much it costs to gain a new customer. Return on Ad Spend (ROAS) measures the revenue generated from advertising efforts, and Conversion Rates show the percentage of leads or visitors who complete a desired action, like a purchase or sign-up.
Which customer metrics should a small business prioritize?
Prioritize Customer Lifetime Value (LTV), which estimates the total revenue a customer will generate throughout their relationship with your business. Also crucial are Churn Rate, indicating how many customers stop using your services, and Net Promoter Score (NPS), which gauges customer loyalty and satisfaction.
What are the benefits of using Google Analytics 4 for my small business?
Google Analytics 4 (GA4) provides a more advanced, event-driven approach to understanding user behavior on your website and app. It offers deeper insights into the customer journey, cross-platform tracking, and enhanced machine learning capabilities to predict future trends, helping you optimize your online presence and marketing strategies.
How can dashboard tools like Google Looker Studio help my business?
Dashboard tools like Google Looker Studio (formerly Data Studio) help you visualize your data from various sources (including GA4) in custom, interactive reports. This makes complex data easy to understand, allowing you to quickly identify trends, monitor KPIs, and share insights across your team, facilitating faster and more informed decision-making.
What does it mean to make data-driven decisions?
Making data-driven decisions means using insights derived from actual data to guide your business strategies and actions, instead of relying on intuition or assumptions. This involves tracking relevant KPIs, analyzing trends, formulating hypotheses, testing changes, and continuously iterating your approach to achieve optimal outcomes and sustainable growth.
About NewBiz Team
The NewBiz Marketing team helps entrepreneurs launch and grow their businesses with proven digital marketing strategies.